

A while back, my friend Mike Fal ( b | t ) released a PowerShell script that can sample the counter inside SQL Server that one of my favorite database benchmarking utilities, HammerDB, uses to produce the transactions per minute counter value that the benchmarking utility outputs.

I thought I’d counter with a means to perform this task directly within SQL Server, and store the results inside a database so that a mathematical analysis can be performed quite quickly and repeatably. I always like to have multiple methods to perform any given action, so that you can select the best tool for a given scenario.
As Mike notes, the best counter used to store this value (prior to SQL Server 2014) is “Batch Requests/sec“, and is very straightforward to collect.
With the introduction of SQL Server 2014, this counter works via Perfmon but within SQL Server the collection just seems ‘off’ and will not report actual performance values. So, switch the counter to ‘Transactions/sec‘ and specify the target database.
To perform this automated collection, follow these easy steps.
Create a container database, or opt to use one of your utility databases.
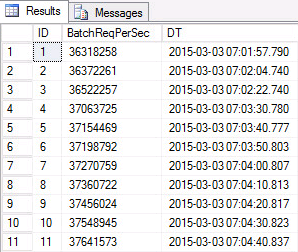
Create a table to store the results. Use or adapt the following DDL for your uses.
| CREATE TABLE [dbo].[BatchReqPerSecLogger]( [ID] [bigint] IDENTITY(1,1) NOT NULL, [BatchReqPerSec] [bigint] NULL, [DT] [datetime] NULL CONSTRAINT [DF_BatchReqPerSecLogger_DT] DEFAULT ( GETDATE() ), CONSTRAINT [PK_BatchReqPerSecLogger] PRIMARY KEY CLUSTERED ( [ID] ASC ) |
Next, create a SQL Server Agent job that executes the following command against this new database every ten seconds. This works for SQL Server versions prior to 2014.
| INSERT INTO dbo.BatchReqPerSecLogger (BatchReqPerSec) SELECT cntr_value FROM sys.dm_os_performance_counters WHERE counter_name = ‘Batch Requests/sec’ |
For SQL Server versions 2014 and above, alter the script to point to the new counter and to your TPCC database.
| INSERT INTO dbo.BatchReqPerSecLogger (BatchReqPerSec) SELECT cntr_value FROM sys.dm_os_performance_counters WHERE counter_name = ‘Transactions/sec’ AND instance_name = ‘tpcc’ |
Disable the job until you need it, and enable it when you begin your tests.
You can create a view on this data that gives you the insight into the database performance trends with a simple query. This query leverages statistics functions found in SQL Server 2012 and beyond. This view shows you the batch requests per minute numbers when you estimate your batch requests per minute by sample period.
| CREATE VIEW dbo.vBatchReqPerSec AS SELECT ID, BatchReqPerSec, DT, LAG(batchreqpersec) OVER (ORDER BY DT) AS PrevSample, LAG(DT) OVER (ORDER BY DT) AS PrevSampleDT, DATEDIFF(ms,LAG(DT) OVER (ORDER BY dt),DT)/1000. AS SecDiff, (batchreqpersec – LAG(batchreqpersec) OVER (ORDER BY DT)) / (DATEDIFF(ms,LAG(DT) OVER (ORDER BY dt),DT)/1000.) as TPS, ((batchreqpersec – LAG(batchreqpersec) OVER (ORDER BY DT)) / (DATEDIFF(ms,LAG(DT) OVER (ODER BY DT),DT)/1000.)) * 60 AS TPM FROM dbo.BatchReqPerSecLogger |
You can now query against this data based on the date and time ranges for your test, and perform whatever analysis you like!
| SELECT * FROM dbo.vBatchReqPerSec WHERE DT >= CAST(‘2015-03-03 7:00’ AS DATETIME) AND DT < cast(‘2015-03-03 7:00’ AS DATETIME) ORDER BY DT |
Now you can quickly perform any sort of analytics that you want on the raw data. Just remember to turn off the Agent job when you are done.
One thing to realize with newer versions of SQL Server 2014 is that the updated cardinality estimator might have an adverse impact to your performance. HammerDB falls into this category! You might actually be experiencing a significant performance degradation of this benchmark on a 2014 instance without a specific trace flag enabled! Read more about this in a great writeup by Justin Goodwin (@sql_jgood) located here.
